
COLOR MY STATES · BLOG
How to Create a US Regions Map with Color My States
Learn how to turn a blank US map into a five-region map with custom colors, state labels, a legend, and a clear explanation of your regional boundaries.
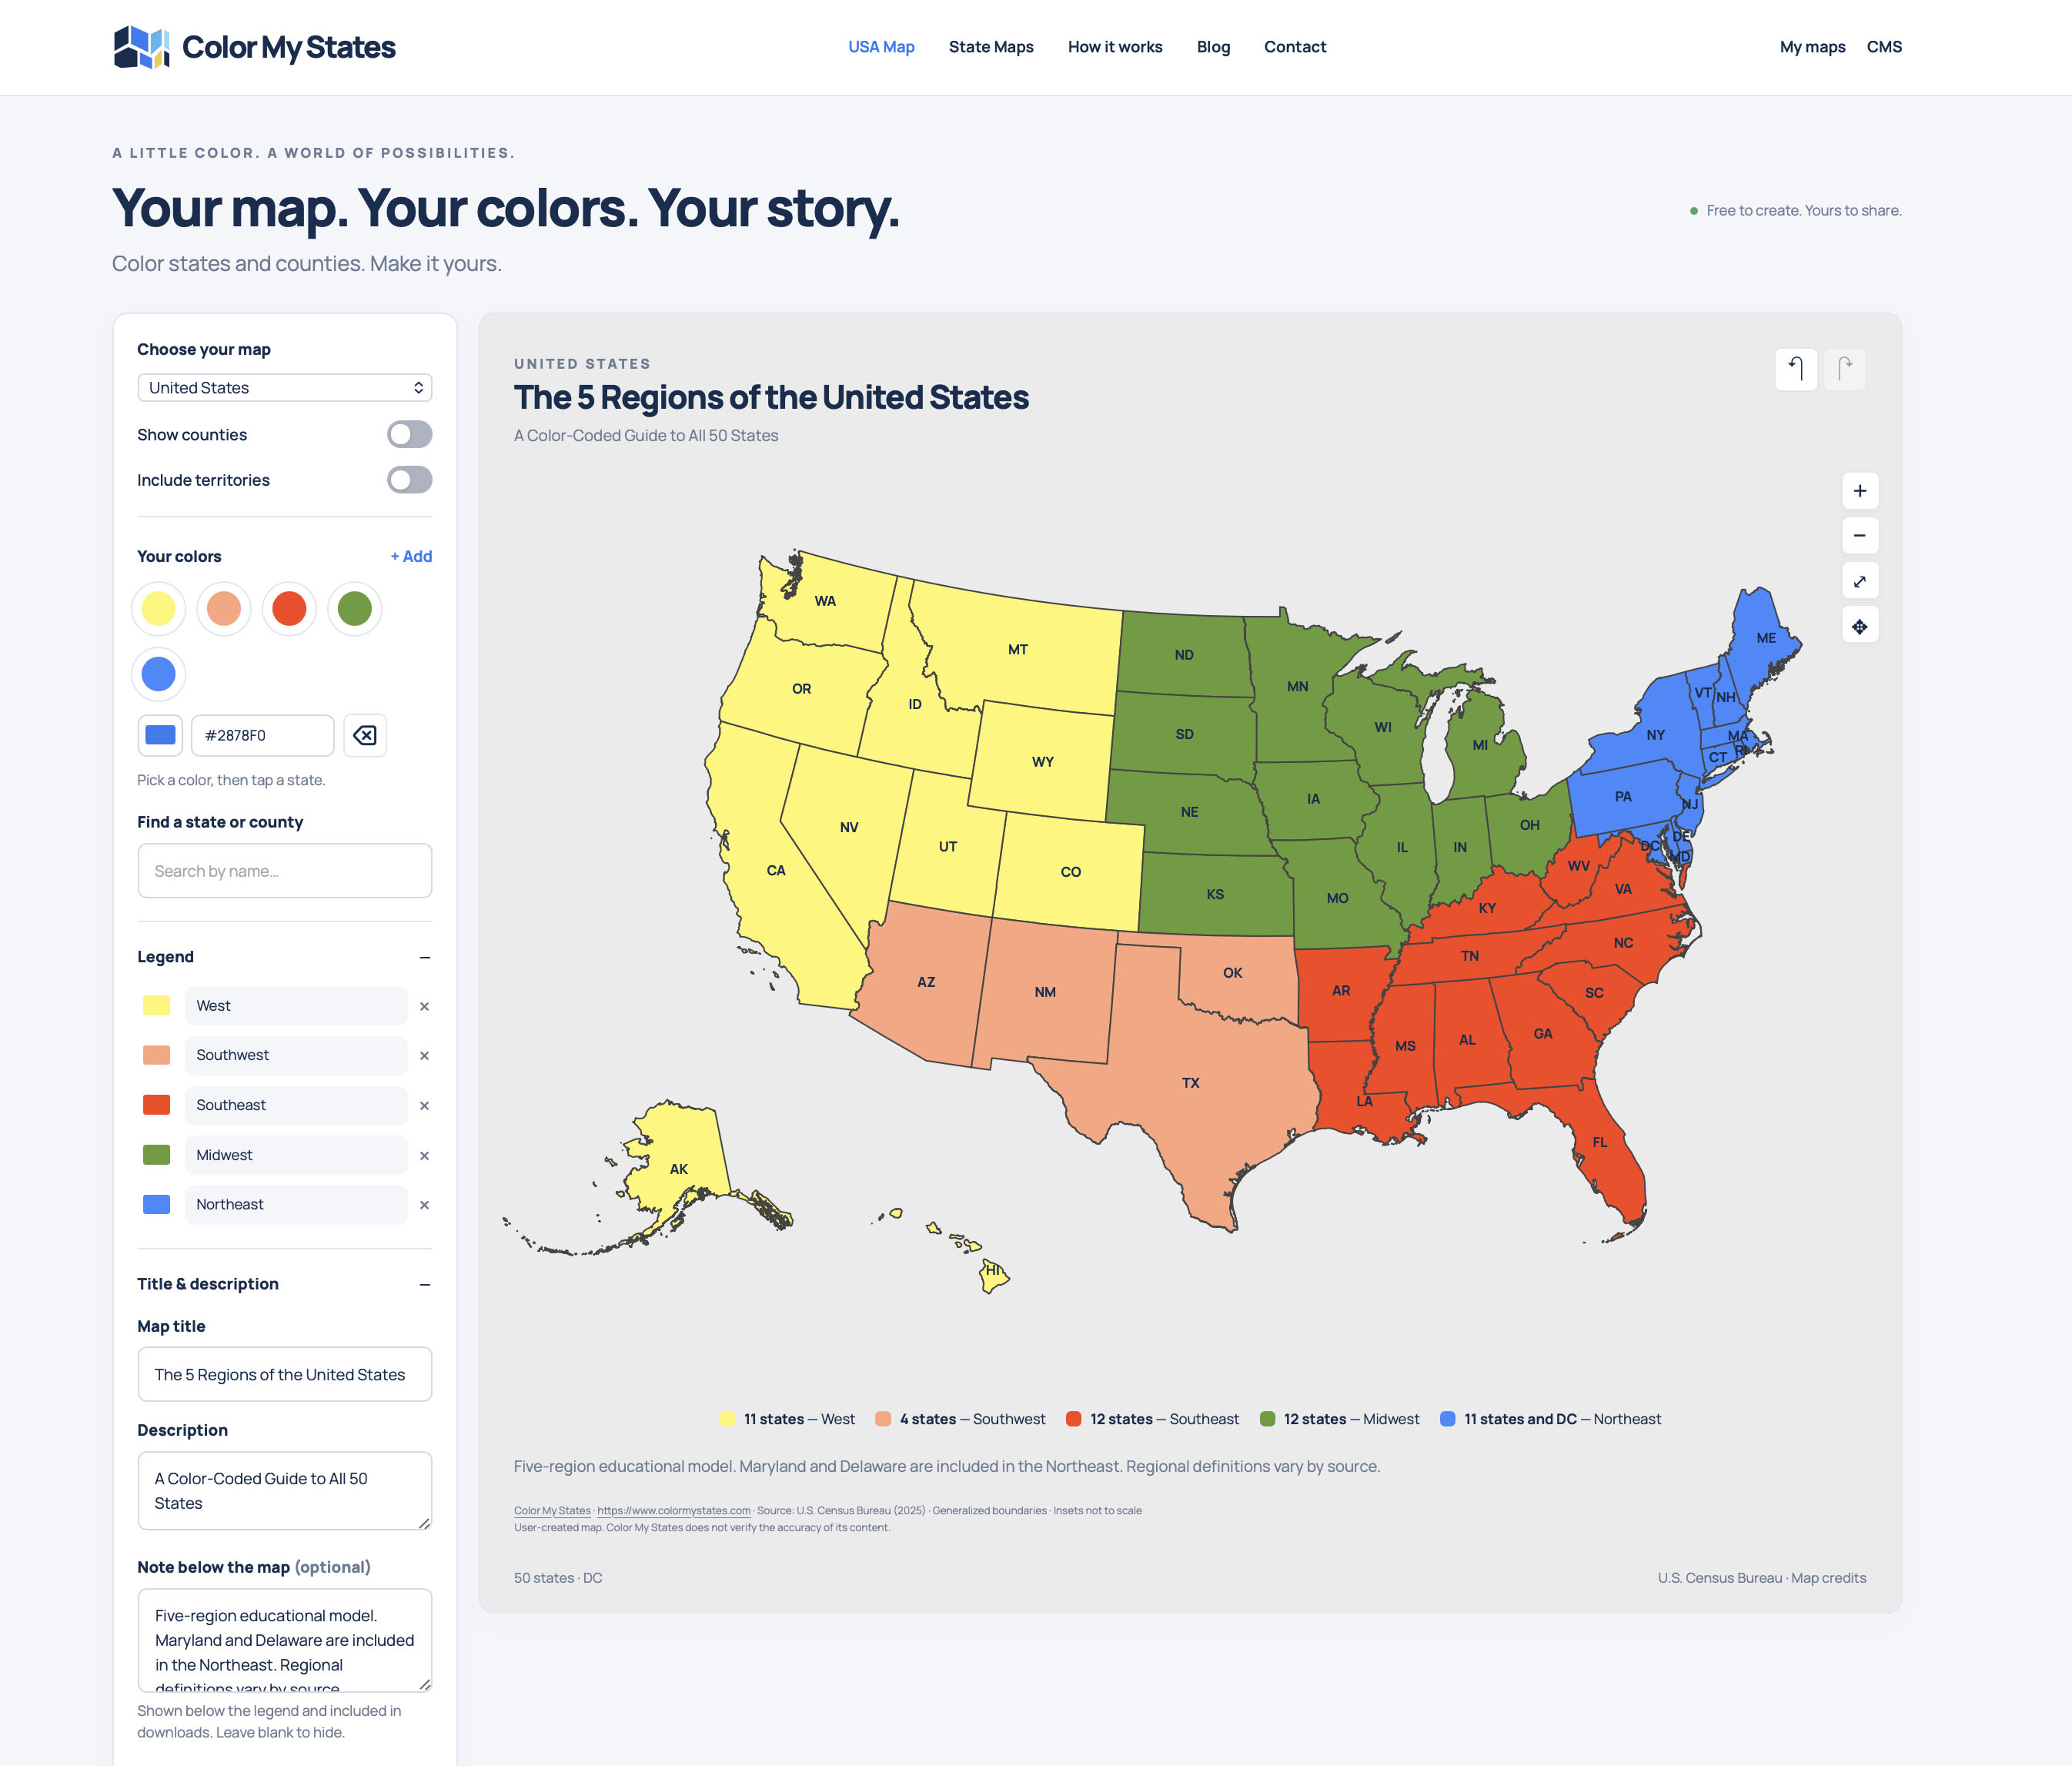
Want to make your own color-coded US regions map? This tutorial shows how to use Color My States to group the 50 states into five regions, add a legend and title, and download your finished map.
Our example uses yellow for the West, salmon for the Southwest, red for the Southeast, green for the Midwest, and blue for the Northeast. You can follow the same color scheme or choose your own.
Before You Start: Choose Your Regional Boundaries
This tutorial follows a five-region educational model with Maryland and Delaware in the Northeast. Regional definitions vary, so use your teacher's instructions if you are completing a school assignment.
Washington, D.C., is also colored blue in our example. It is a federal district, not a state: the map contains 50 states plus D.C.
1. Choose the United States Map and Set Up Your Colors
Open Color My States and select United States under Choose your map. Keep Show counties and Include territories switched off for this example.
Under Your colors, prepare five colors. Use + Add if you need another color, and use the color control to adjust your selection. In the Legend section, give each color its region name:
- Yellow: West
- Salmon: Southwest
- Red: Southeast
- Green: Midwest
- Blue: Northeast
These colors are design choices, not official regional colors. Written legend labels help readers understand what each color represents.
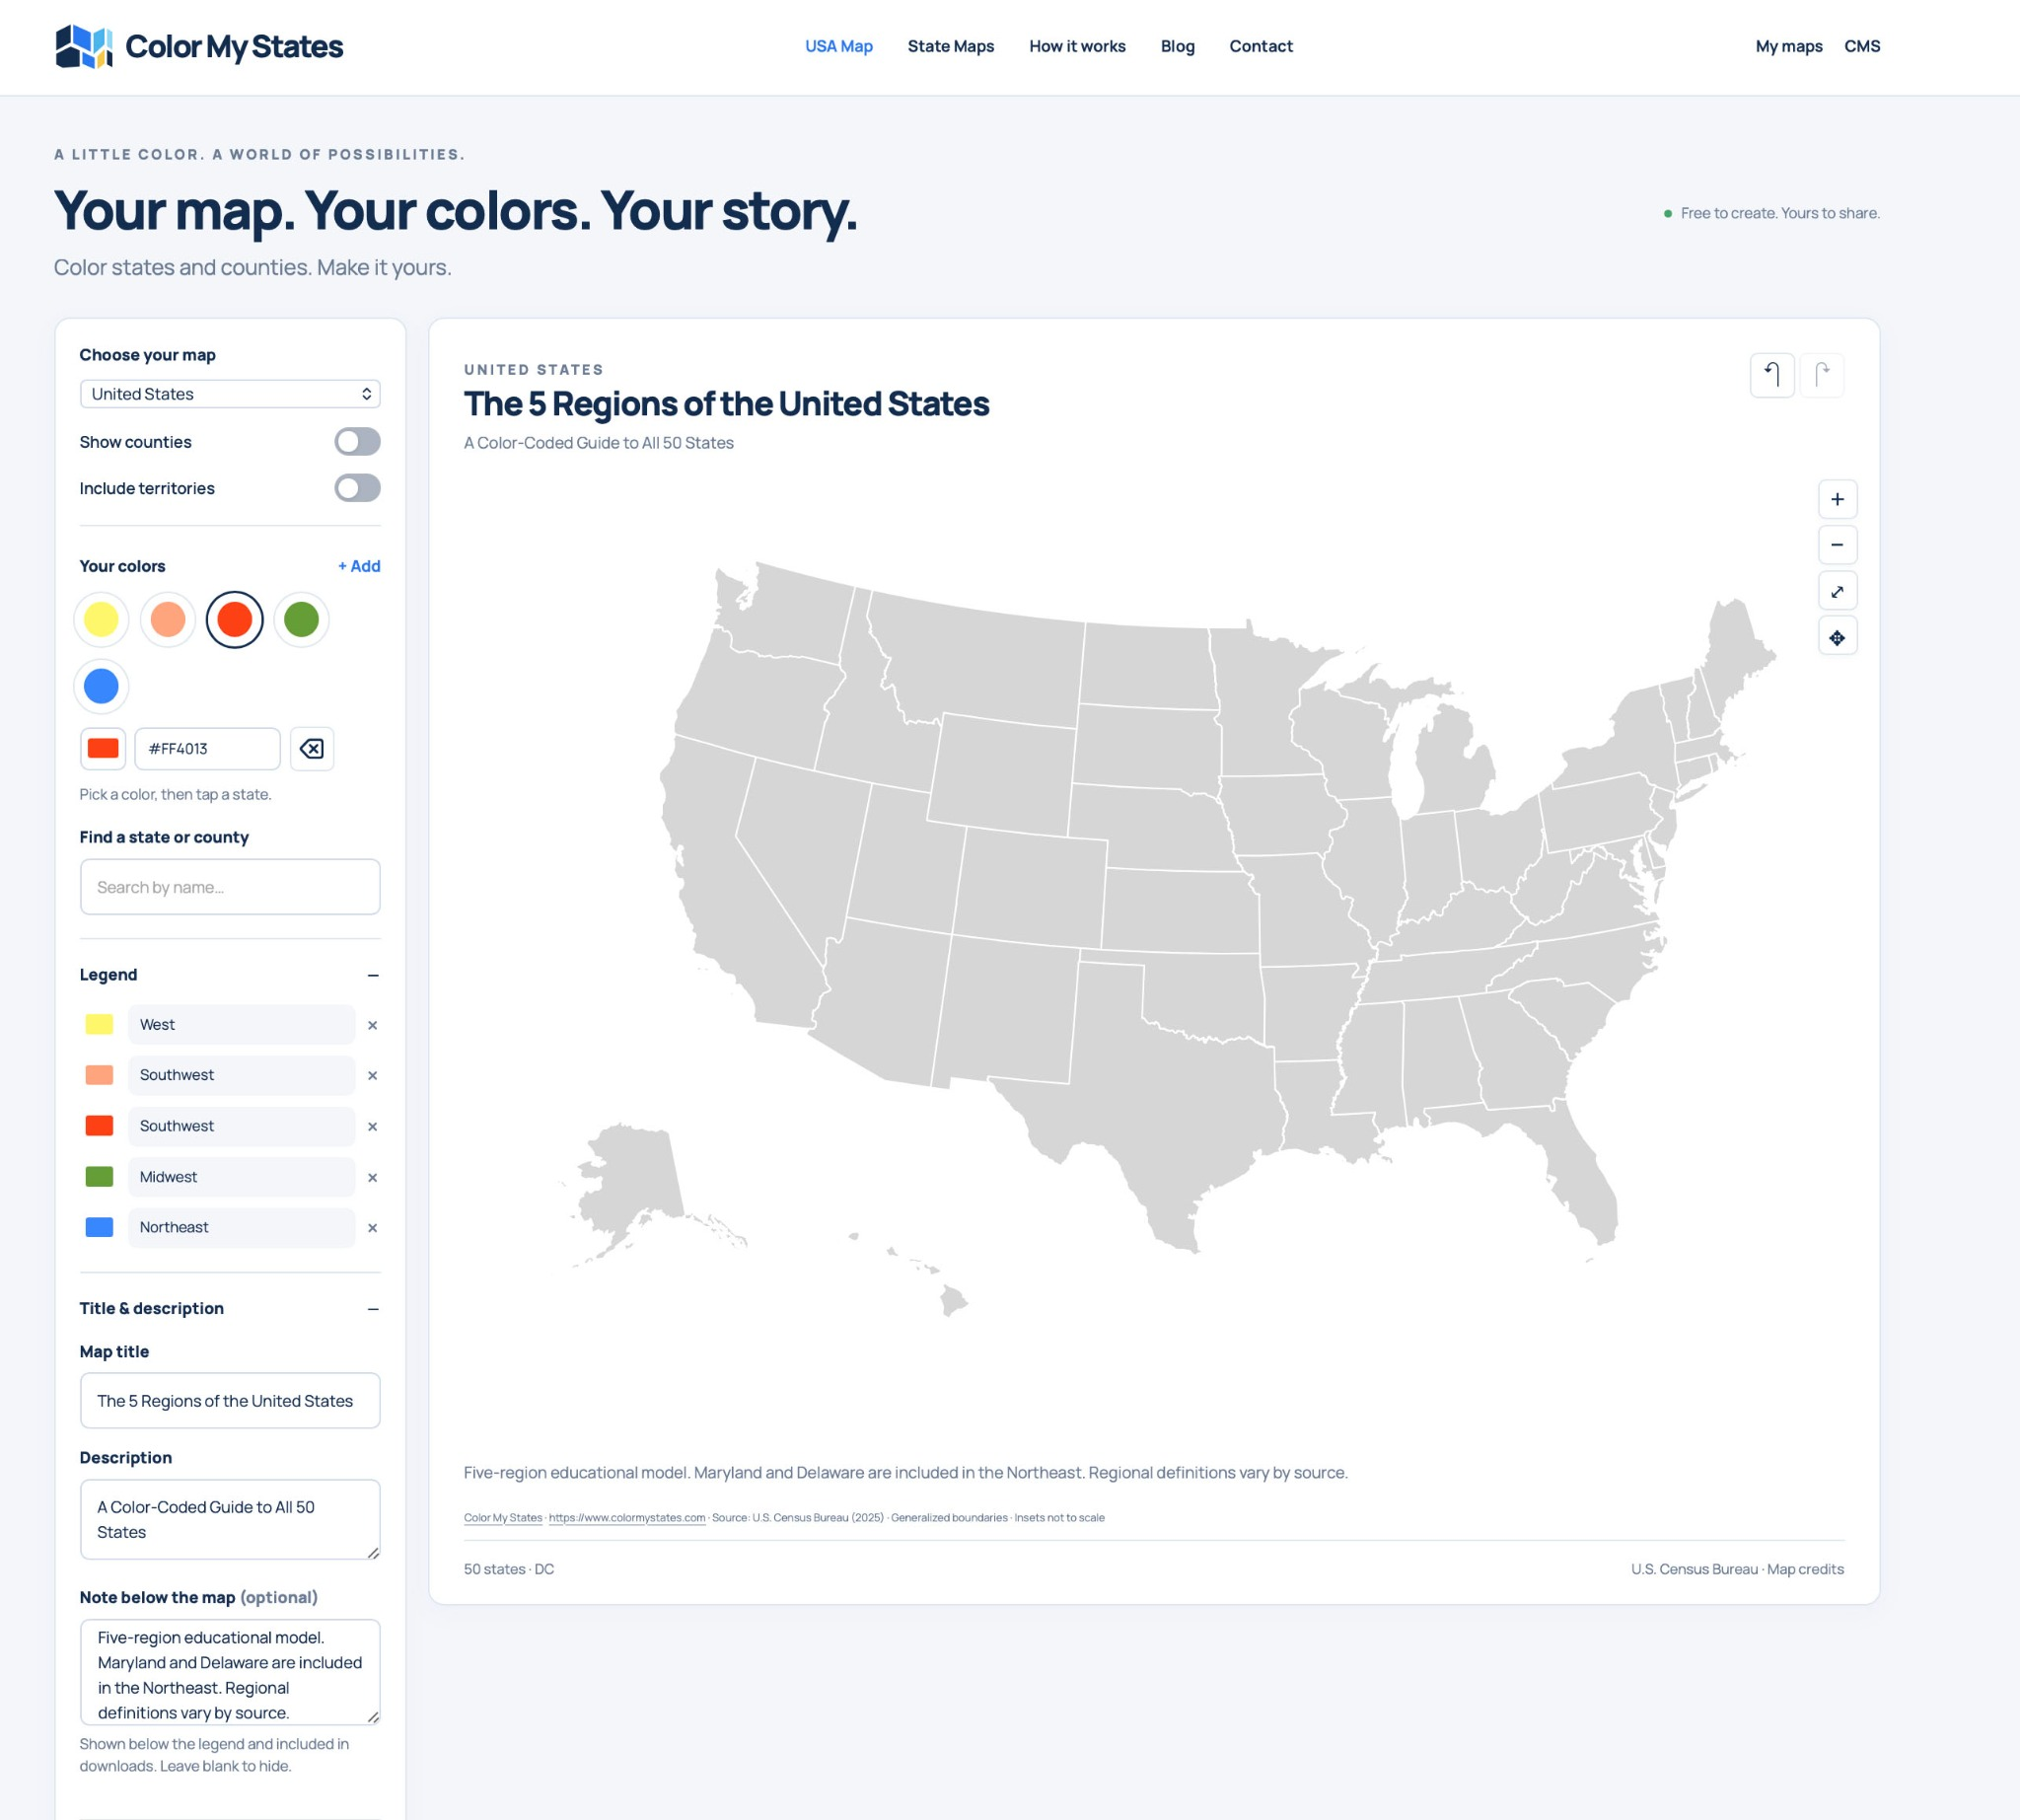
Set up the United States map, five colors, and region names. Screenshot correction: the red legend entry should read “Southeast”; the salmon entry is “Southwest.”
2. Add a Map Title and Subtitle
Open Title & description. Use a title that explains the subject and a short description that tells readers what the map covers.
To follow our example, enter:
- Map title: The 5 Regions of the United States
- Description: A Color-Coded Guide to All 50 States
The description appears as a subtitle below the map title. Keep it short so the heading remains easy to read.

The Map title and Description fields control the heading above the map. This detail screenshot illustrates the text settings; its map colors are not the final regional colors.
3. Explain Your Regional Classification
Use Note below the map (optional) to explain the boundaries you chose. This note appears below the legend and is included in downloads.
Our example uses the following text:
Five-region educational model. Maryland and Delaware are included in the Northeast. Regional definitions vary by source.
If you also color Washington, D.C., blue, you can add: “Washington, D.C., is shown with the Northeast and counted separately from the 50 states.”

Add a short classification note so readers can understand your map when it is downloaded or shared separately from this tutorial.
4. Color the States One Region at a Time
Select a color under Your colors, then click or tap the states that belong to that region. Finish one group before moving to the next color.
Use the following checklist to recreate our map. Every state should appear in exactly one group.
West: Yellow — 11 States
Alaska (AK), California (CA), Colorado (CO), Hawaii (HI), Idaho (ID), Montana (MT), Nevada (NV), Oregon (OR), Utah (UT), Washington (WA), and Wyoming (WY).
Remember to color Alaska and Hawaii yellow too. They belong to the West even though they appear in separate map insets.
Southwest: Salmon — 4 States
Arizona (AZ), New Mexico (NM), Oklahoma (OK), and Texas (TX).
Southeast: Red — 12 States
Alabama (AL), Arkansas (AR), Florida (FL), Georgia (GA), Kentucky (KY), Louisiana (LA), Mississippi (MS), North Carolina (NC), South Carolina (SC), Tennessee (TN), Virginia (VA), and West Virginia (WV).
Midwest: Green — 12 States
Illinois (IL), Indiana (IN), Iowa (IA), Kansas (KS), Michigan (MI), Minnesota (MN), Missouri (MO), Nebraska (NE), North Dakota (ND), Ohio (OH), South Dakota (SD), and Wisconsin (WI).
Northeast: Blue — 11 States
Connecticut (CT), Delaware (DE), Maine (ME), Maryland (MD), Massachusetts (MA), New Hampshire (NH), New Jersey (NJ), New York (NY), Pennsylvania (PA), Rhode Island (RI), and Vermont (VT).
For this example, also color Washington, D.C. blue. Keep it separate from the state count.
Use Search for Small or Hard-to-Find Areas
Small areas can be difficult to select directly. Use Find a state or county to search by name. With the intended color selected, use Apply current color to whole state in the result panel. The screenshot shows the District of Columbia result.
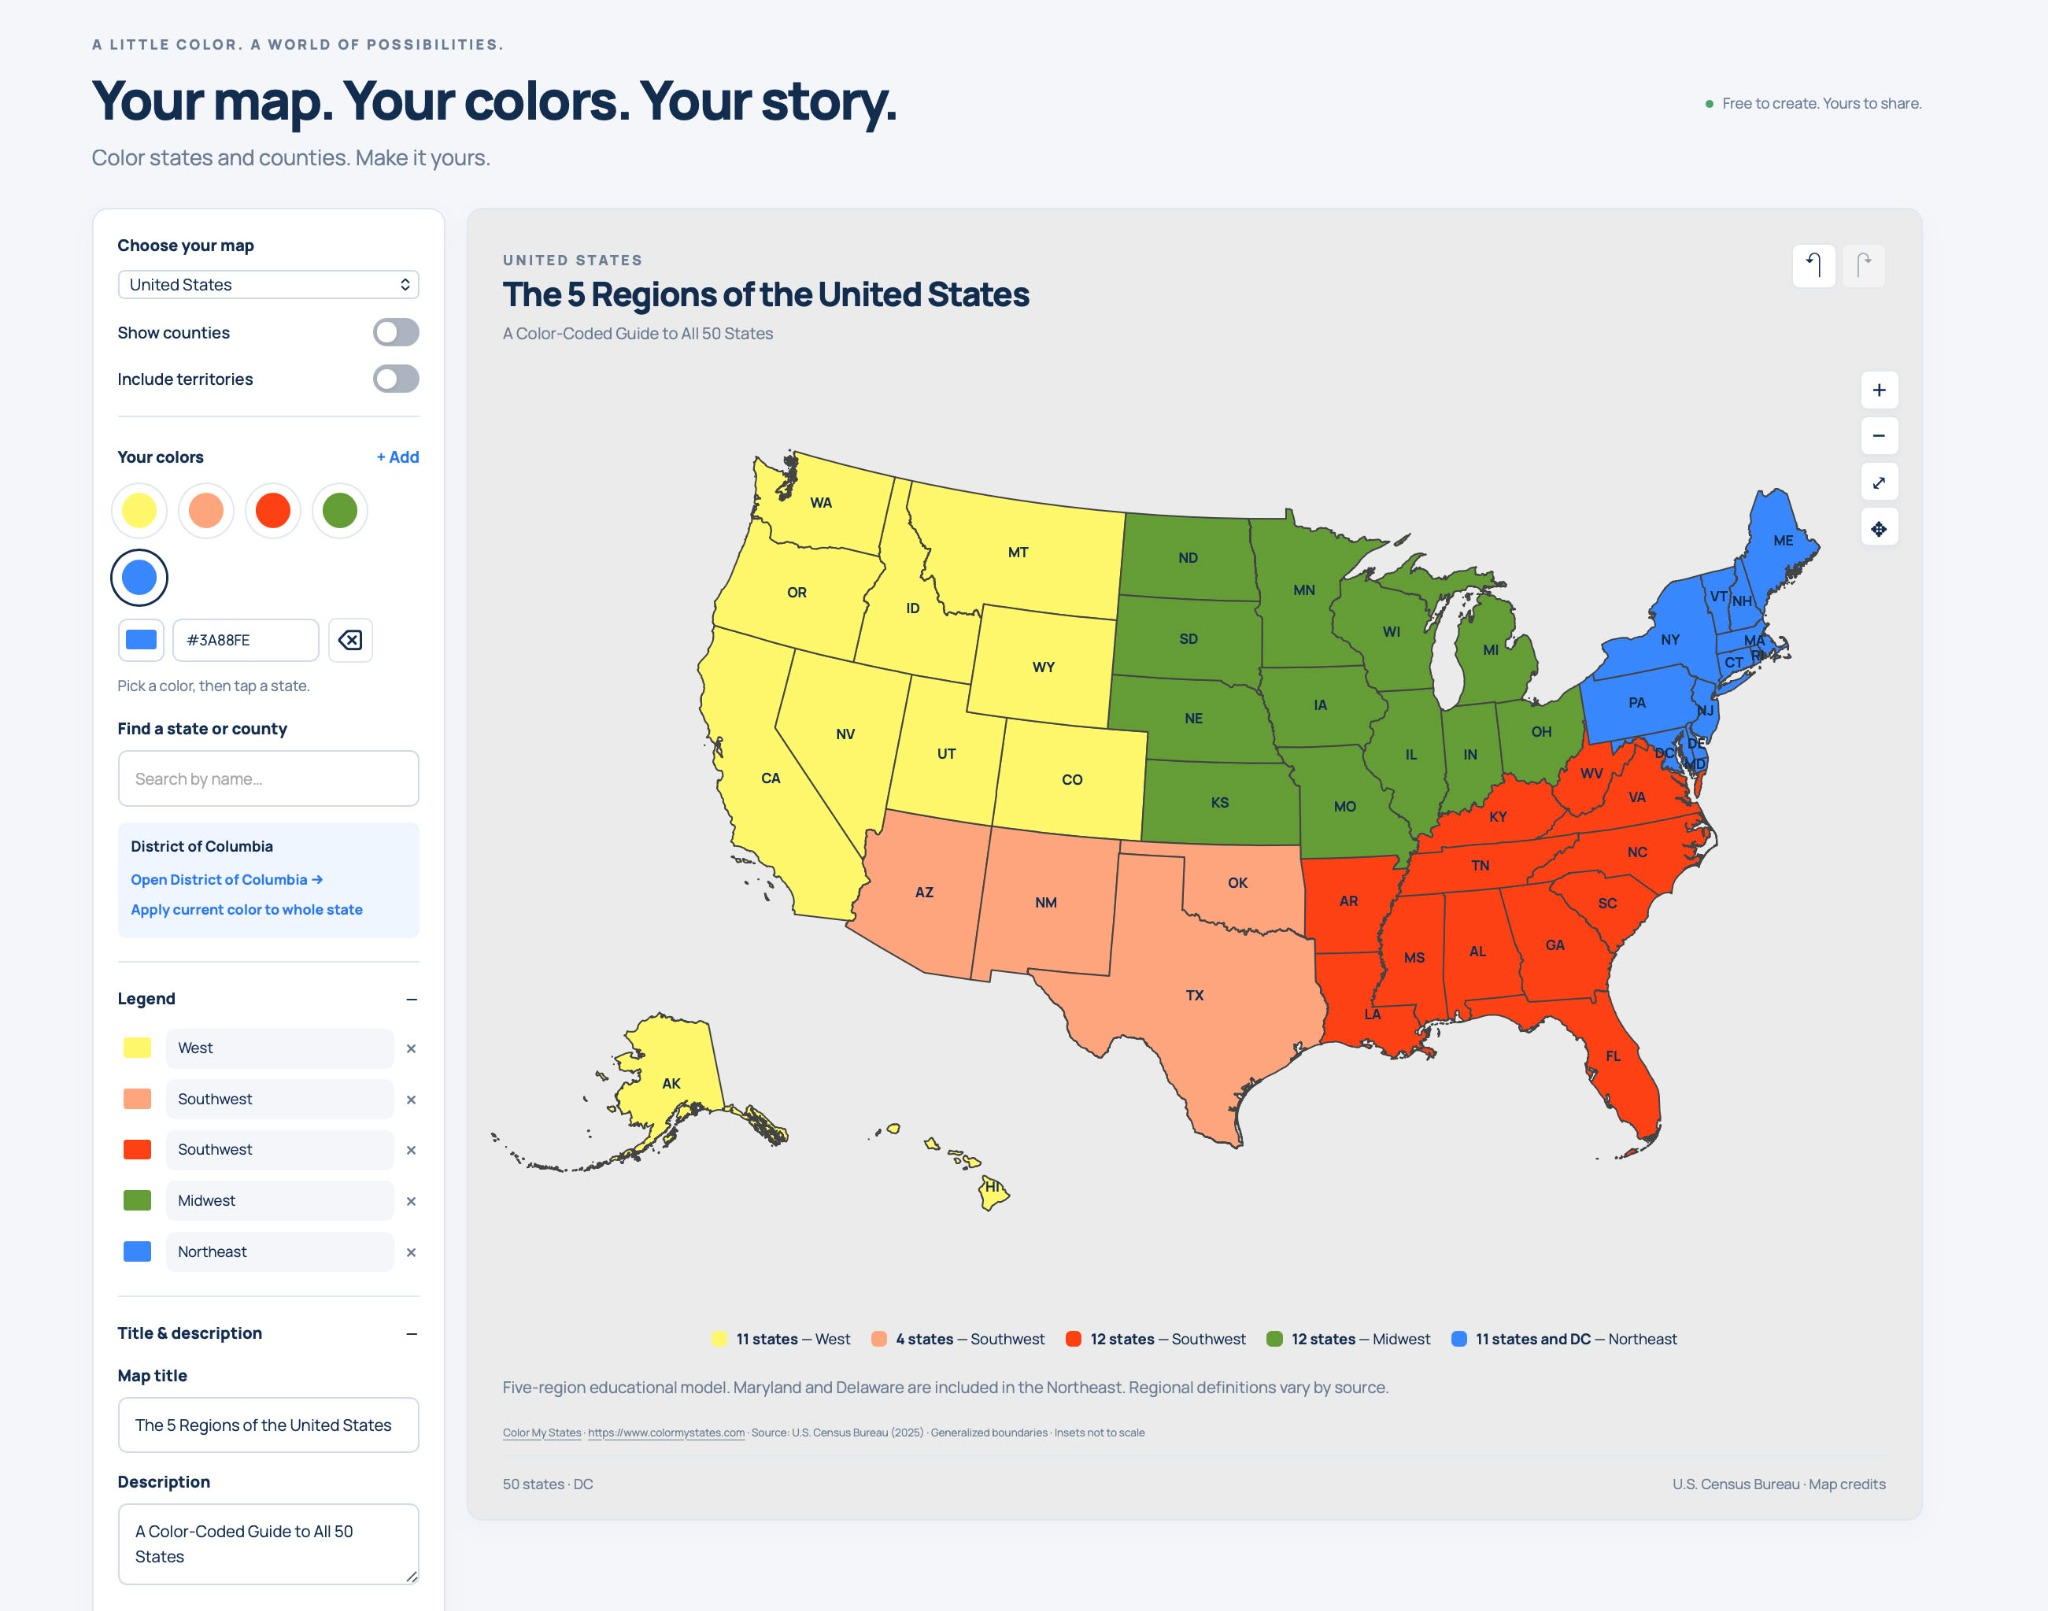
The colored map with the search result for Washington, D.C. The red group should be labeled “Southeast” in both the sidebar and the map legend.
5. Check the Counters, Labels, and Borders
Switch on Show counters to display the number of states assigned to each legend color. Check that the totals match your regional classification:
- West: 11 states
- Southwest: 4 states
- Southeast: 12 states
- Midwest: 12 states
- Northeast: 11 states, plus D.C. separately
The state totals should add up to 50. Counts are a useful check, but also compare the individual states with the lists above: two incorrectly assigned states could leave the totals unchanged.
In Background & borders, choose a background and border color that keep the state shapes visible. Our finished example uses a light gray background and dark borders.
Turn on State labels to show state abbreviations. Choose a readable text color and adjust the optional Text outline if needed. Check the smaller northeastern states carefully.
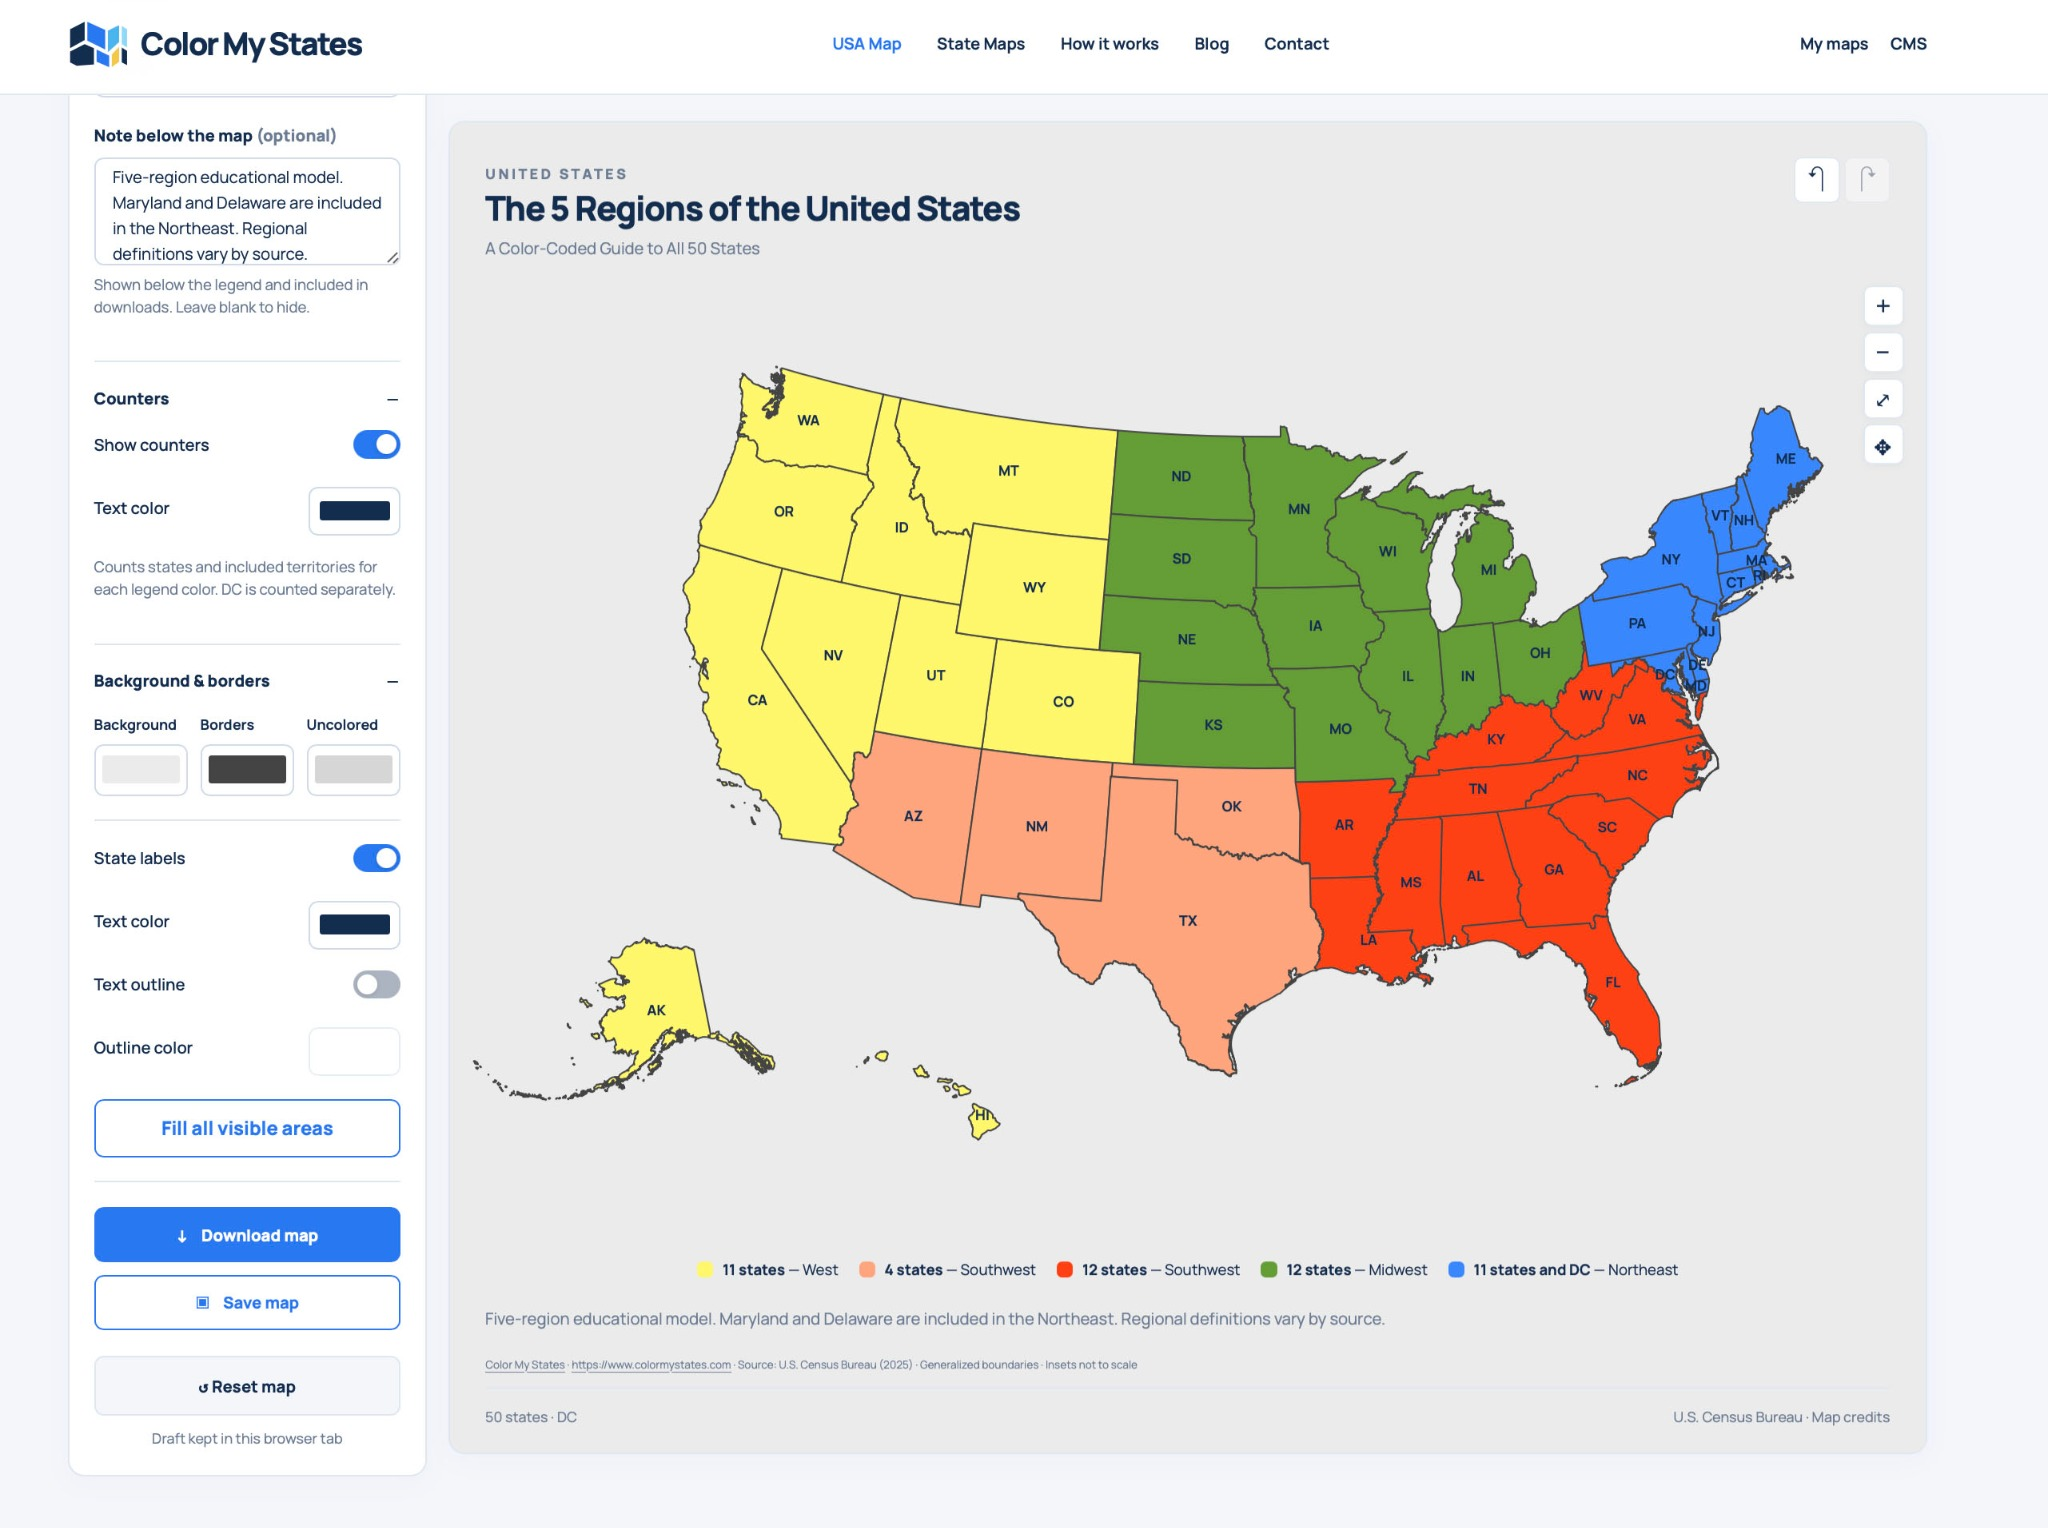
Review the counters, background, borders, and state labels before using Download map. In this screenshot, the red group's legend label still needs to be changed from “Southwest” to “Southeast.”
6. Download and Review Your Finished Map
When the map is ready, click Download map and choose from the export options shown. Open the downloaded image and check it before sharing or printing.
- Make sure all 50 states have the correct color.
- Check that the red group is named Southeast and the salmon group Southwest.
- Confirm that Alaska and Hawaii are included.
- Read the title, subtitle, legend, and classification note at the size you intend to use.
- Check that D.C. is identified separately from the 50 states.
The sidebar also includes Save map. Use that option if you want to save an editable map, following any sign-in prompts shown. Downloading an image and saving an editable map serve different purposes.
Ways to Use Your US Regions Map
Your finished map can illustrate a geography lesson, accompany a school presentation, or help organize travel ideas by region. For a printed handout, check that the legend and small state labels remain readable at the chosen print size.
You can use the same workflow for other state groupings: choose a purpose, assign colors, name your legend entries, and explain what the colors mean.
Frequently Asked Questions
Do I have to use these five colors?
No. Choose colors that work for your project. Keep them distinct and include written labels in the legend.
Why are Maryland and Delaware blue?
This tutorial places both states in the Northeast. Other regional maps may group them differently, which is why the classification note matters.
Does Washington, D.C., make the total 51 states?
No. D.C. is a federal district. The example shows 50 states plus D.C., with D.C. counted separately.
Can I make a map without county boundaries?
Yes. Keep Show counties switched off to create the state-level map used in this tutorial.
How do I make the downloaded map understandable on its own?
Add a clear title, descriptive legend labels, and a short note explaining your regional boundaries. Review those elements in the downloaded image before sharing it.
Ready to create your own version? Open Color My States and start with your first regional color.